
Wave Period and Wavelength: What Deep-Water Numbers Mean
Convert wave period to wavelength with the deep-water formula. Compare crest and group speeds, check the depth assumption and follow clear worked examples.
By ActionSportsHQ Editorial · Published · 6 min read
At a glance
- Period measures time and wavelength measures distance; converting between them requires a wave model.
- In the linear deep-water model, wavelength grows with period squared, while crest speed grows with period.
- Group speed and crest speed differ, and the deep-water depth assumption must be checked for each period.
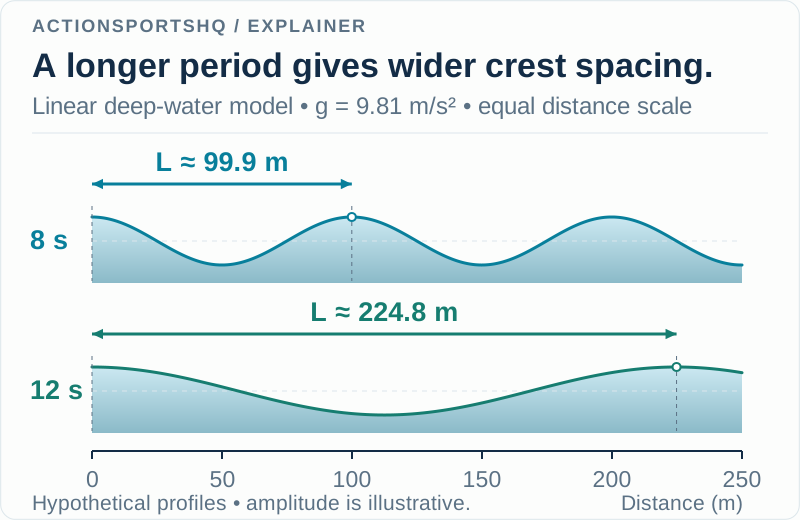
Wave period is the time between successive crests passing a point; wavelength is their spatial separation. In the linear deep-water model, wavelength is L = gT²/(2π). With g = 9.81 m/s², a 12-second period gives about 224.8 m wavelength, provided the depth and other model assumptions hold.
Crest speed and group speed are separate results: the group travels at half the crest speed in this model. The original calculations below show the units, depth check and reference being tracked. They do not assign one spacing to every wave in a mixed sea or predict breaking-wave height.
Separate a stopwatch measurement from a spatial snapshot
Picture a fixed observation point. The time between successive corresponding parts of a regular wave is its period, T. Now picture a snapshot along the direction of travel. The distance between successive crests is wavelength, L. NOAA’s anatomy diagram identifies this crest-to-crest distance; CDIP distinguishes it from the time measurement. 1 4
That difference changes how you read an image. A photograph with no distance scale cannot supply wavelength merely because two crests are visible. A short video with a timestamp can help illustrate intervals at a fixed point, but a moving camera changes the observation problem. Keep the measurement method beside the number.
Use one equation for distance and another for speed
For the linear deep-water approximation, the FHWA coastal-science manual gives:
L = gT² / (2π)
The crest’s phase speed is c = L/T, so substitution gives c = gT/(2π). 2 Here, π is the mathematical constant, T is in seconds, L is in metres and c is in metres per second. The numerical coefficient g/(2π) ≈ 1.5613 carries the units needed by these formulas.
For our twelve-second example, the steps are:
- Square the period: 12² = 144 s².
- Multiply by gravity: 9.81 × 144 = 1,412.64 m.
- Divide by 2π: L ≈ 224.83 m.
- Divide that distance by twelve seconds: c ≈ 18.74 m/s.
The last division is a useful error check. If a spreadsheet reports a wavelength of 224.83 m and a crest speed of 9.37 m/s for that same period, the two columns are describing different speeds or one is mislabeled. The group-speed calculation below explains where 9.37 belongs.
Compare ratios before rounding the results
Our calculated examples are:
| Period T | Wavelength L | Crest speed c | Group speed cg | Half-wavelength L/2 |
|---|---|---|---|---|
| 8 s | 99.9 m | 12.49 m/s | 6.25 m/s | 50.0 m |
| 12 s | 224.8 m | 18.74 m/s | 9.37 m/s | 112.4 m |
| 16 s | 399.7 m | 24.98 m/s | 12.49 m/s | 199.8 m |
Going from eight to twelve seconds multiplies period by 1.5. Wavelength is multiplied by 1.5² = 2.25, while crest speed is multiplied by 1.5. Thus, “50% longer period” and “50% more spacing” are different statements in this model.
Going from eight to sixteen seconds makes the contrast stronger: period doubles, wavelength quadruples and crest speed doubles. These ratios come directly from how the variables appear in the equations. Calculating ratios before rounding avoids comparing 100 m with 225 m and mistakenly treating the rounding as additional precision.
Check depth separately for each row
“Deep water” here is a relationship between depth and wavelength, rather than a fixed depth category. The usual criterion is d > L/2. 2 The same water depth can therefore meet the approximation for one period and fail it for another.
Suppose our hypothetical calculation point has a depth of 150 m. That exceeds 50.0 m and 112.4 m, but not 199.8 m. The eight- and twelve-second rows meet this depth criterion; the sixteen-second row does not. Writing “offshore” beside all three rows would conceal that difference.
The half-wavelength value is rounded in the table. Check with unrounded numbers when values are close. Also treat this as a conventional approximation, not a physical switch that makes bottom influence abruptly vanish. The equations additionally idealize the waves and omit ambient currents. A depth check alone does not validate every other assumption.
Track the crest and the group with different labels
Phase speed tracks a repeating part of the wave, such as a crest. Group speed describes propagation of a wave group’s energy. In the linear deep-water limit, cg = c/2. NOAA’s wave-forecasting memorandum states this distinction. 3
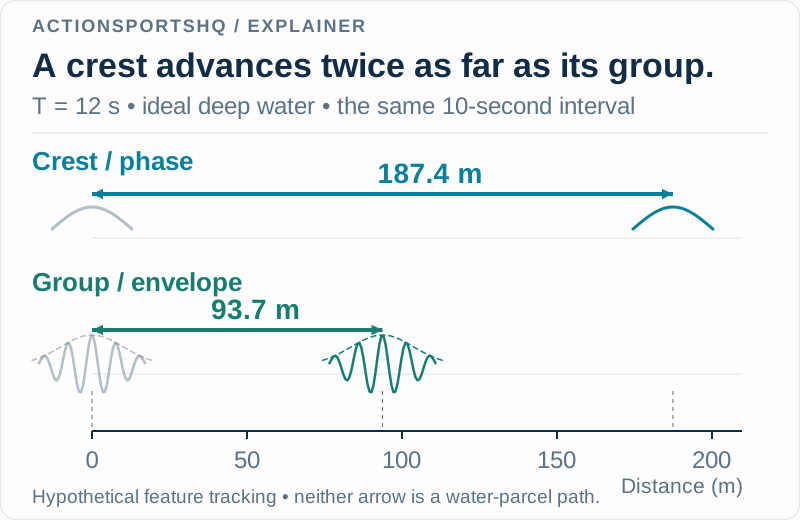
For ten seconds of elapsed time in our example, the crest-speed calculation gives 18.7357 × 10 ≈ 187.4 m. The group-speed calculation gives 9.3679 × 10 ≈ 93.7 m. Neither arrow is a current measurement or a claim that a water parcel follows the arrow.
A caption saying only “wave speed” leaves this distinction unresolved. In a worked note, name the feature being tracked before reporting the result. That small labeling choice prevents a factor-of-two disagreement from being mistaken for a rounding error.
Keep a reproducible calculation record
A useful record contains the input period, its provider’s definition, units, assumed depth, gravity constant, equations and chosen speed label. Add a column that says whether the depth criterion was met. Keep calculated results separate from observed values, so a later reader can see which numbers came from an instrument and which came from your model.
Real waves contain varying periods, heights and directions; CDIP explains why an ideal regular wave is a teaching model. 4 Consequently, applying this calculation to a displayed peak period produces a wavelength associated with that modeled component. It does not assign identical spacing to every visible wave.
For the surrounding forecast labels, read height, period and direction together. To distinguish the changing water level from horizontal water movement, continue with tide height, range and current. The calculations here answer a narrower question: how the stated deep-water model connects seconds, metres and two different propagation speeds.
Reader questions
How long is a twelve-second wave in deep water?
In the linear model with g = 9.81 m/s², L = gT²/(2π) gives about 224.8 m. That calculation assumes sufficiently deep water, conventionally depth greater than half the wavelength, plus the other model assumptions. It does not predict breaking-wave height or suitability.
Is wave period the same as wave speed?
No. Period is a time interval in seconds. Speed is distance per time. The deep-water model connects them, but the resulting crest speed differs from group speed and from the velocity of the water itself.
Does doubling period double wavelength?
In the linear deep-water model, doubling period multiplies wavelength by four and crest speed by two. Keep that model boundary attached to the comparison rather than extending it to shallow water.
Sources and scope
Each reference supports the topic stated in its scope note. Worked examples are illustrative unless identified as measured results. Use current local information and the manual for your own equipment alongside appropriate practical instruction.
- NOAA JetStream: anatomy of a waveCrest, trough, height and the distance represented by wavelength; no local surf interpretation.
- Federal Highway Administration: Highways in the Coastal Environment, HEC-25Chapter 4, equations 4.3–4.5, gives linear deep-water wavelength and phase speed with the depth-to-wavelength condition.
- NOAA NWS: Spectral Techniques in Ocean Wave Forecasting, WR-133Definition of group velocity and its deep-water relationship to wave celerity; no operational forecast method is reproduced.
- Scripps CDIP: wave measurementWave period and wavelength, simple-wave models and the variability of real ocean waves.
Continue reading
- How to Read a Surf Forecast: Height, Period and Direction
Decode surf forecast labels with worked component comparisons. Separate combined seas, swell period and direction, then keep a record using the Swell Component Lab.
- Tide Height vs Tidal Range vs Current: Read Each Value
Compare tide height, tidal range and current speed using datum and timing examples. Learn why high water cannot tell you when slack current occurs at a site.
- Hydrofoil Surfing Explained: Lift, Pitch and Foil Parts
Learn how a surf hydrofoil generates lift, what the mast and wings do, and why pitch, water flow and the complete setup matter more than area alone.