
Tide Height vs Tidal Range vs Current: Read Each Value
Compare tide height, tidal range and current speed using datum and timing examples. Learn why high water cannot tell you when slack current occurs at a site.
By ActionSportsHQ Editorial · Published · 7 min read

At a glance
- Tide height needs a named vertical datum; tidal range is a difference between specified high and low levels.
- Tidal current is horizontal water motion and needs its own speed, direction, location and time information.
- High or low water does not universally coincide with slack water; local current predictions are separate products.
Tide height is a water level relative to a stated zero or datum. Tidal range is the difference between a specified high and low water level. Tidal current describes horizontal water motion associated with tides, including its speed and direction. A high-water time does not universally identify slack current.
Keep those quantities in separate records even when an app displays them together. The fictional datum and timing examples below show why changing a reference affects a height, why a shared offset cancels from a range, and why a height curve cannot supply a missing current prediction.
Give each quantity a complete label
Consider these three entries in an imaginary notebook:
| Entry | Complete description | The question it answers |
|---|---|---|
| 2.1 m at 10:00 | Water level at Station A, relative to Datum A | How high is the surface relative to this zero? |
| 2.4 m for one high-low pair | Difference between two specified extrema at Station A | How far apart are these two levels? |
| 0.8 m/s toward a stated bearing | Current at a separate location, depth and time | How fast and in which direction is water moving there? |
The numbers are hypothetical. Notice that metres appear in both of the first two rows, while the last row has metres per second. Subtracting two heights can produce a range. It cannot produce a horizontal current speed without further information about the actual water system.
NOAA publishes tide-height predictions and tidal-current predictions as separate products. 1 That separation belongs in your notes even when a single application places them in adjacent cards.
A height depends on the chosen zero
A datum supplies the reference elevation for a reported height. NOAA’s datum documentation distinguishes several tidal references and emphasizes their local basis. 2 “Metres above sea level” is incomplete if the underlying product actually uses a named tidal datum.
Imagine one physical high level and one physical low level. In our invented Datum A, their heights are 3.2 m and 0.8 m. Now choose Datum B exactly 1.0 m higher than Datum A. The same surfaces become 2.2 m and −0.2 m above B. No water moved during this change of labels.
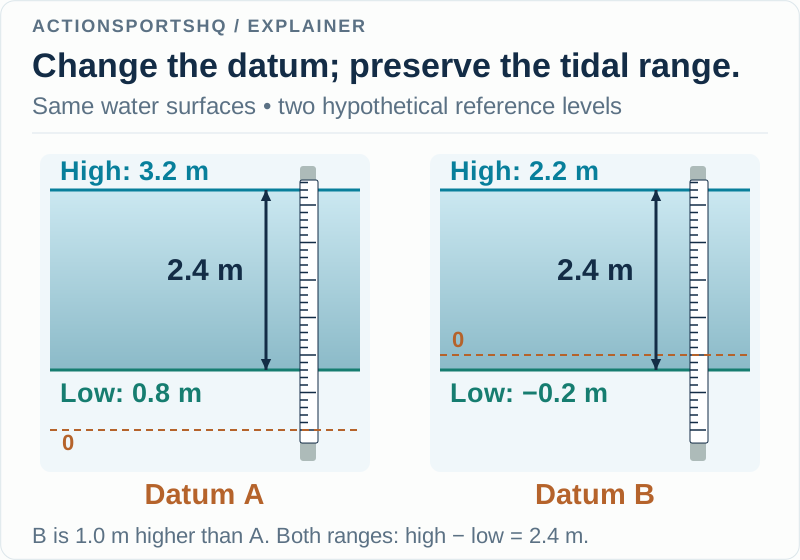
The minus sign in −0.2 m describes the surface’s position relative to B. It does not describe the distance from surface to seabed. That distinction is useful whenever a graph crosses its zero line: first identify the reference before interpreting the sign.
For a real comparison, do not create a conversion by subtracting two datum names or by assuming a familiar offset from another harbour. Retain the station’s published reference information. Our example works because the relationship between its two invented zeros was explicitly supplied.
Range cancels a shared datum offset
Using Datum A, our pair gives 3.2 − 0.8 = 2.4 m. Using Datum B, it gives 2.2 − (−0.2) = 2.4 m. The unchanged difference is the point of this example. Adding or subtracting the same constant from both levels changes the labels but preserves their separation.
The cancellation fails if you silently combine heights with different zeros. Taking 3.2 m from A and −0.2 m from B produces 3.4 m, which is not the separation of our physical high and low surfaces. The arithmetic succeeds while the comparison fails.
Label the chosen high-low pair and time interval too. A range for one pair is not automatically a daily maximum-to-minimum range or a long-term mean. NOAA’s glossary distinguishes event quantities from named mean tidal measures. 3 In a mixed sequence with unequal highs or lows, changing which pair you select changes the question.
A high-water time cannot fill an empty current column
NOAA explains that the relationship between water-level extrema and current events varies by location. Its examples include standing-wave and progressive-wave cases with different timing. 1 This provides a direct counterexample to the idea that all high-water times identify slack current.
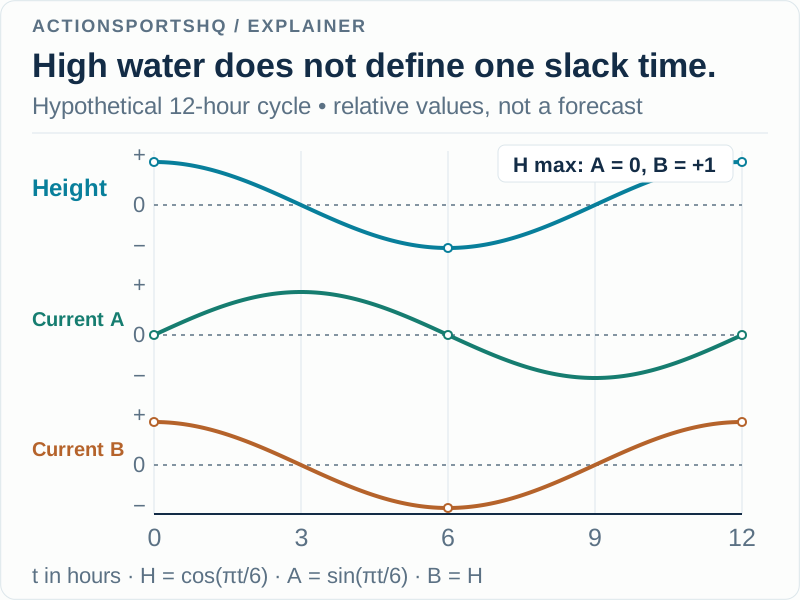
In the drawing, H = cos(πt/6) represents relative height. Two possible relative-current curves are A = sin(πt/6) and B = cos(πt/6). At t = 0, height is at a maximum. A equals zero, while B equals its positive maximum. Both comparisons use exactly the same height curve.
At t = 3, the roles change: A is at its positive maximum and B is zero. The example shows why height alone cannot choose between these current records. It does not claim that every real site matches either simple curve.
The sign on a current graph needs its own convention. In this illustration, plus and minus merely denote opposing directions. For an actual product, preserve its stated direction definition and location rather than assuming that positive always means the direction you have in mind. NOAA defines slack in terms of current speed near zero, rather than the height graph’s maximum. 3
Compare two products without mixing their metadata
Build two rows rather than squeezing everything into a single “tide” field. In the water-level row, retain station identity, datum, units, date, time zone and whether the value is predicted or observed. In the current row, retain the relevant current location, measurement or prediction depth where provided, units, direction convention and valid time.
Suppose an application shows high water at 11:20 and a current maximum at 12:10. Before deciding that the displays disagree, check whether they describe the same location and the same physical quantity. Preserve both timestamps. Replacing the current entry with the high-water entry would remove information rather than reconcile it.
Keep a missing current record visibly missing. A note reading “current timing not obtained” is more useful than an inferred slack time that later looks like a published prediction.
Preserve predictions and observations as different records
NOAA’s astronomical tide predictions do not include every short-term effect of weather and runoff. 1 If an observation differs from a prediction, retain the original prediction, the observation time and the source of each. Do not overwrite the earlier value and lose the comparison.
For example, a fictional prediction of 1.8 m and an observation of 2.0 m give an observed-minus-predicted difference of +0.2 m, provided time, location and datum match. That residual is a calculation, not an identification of its cause. A single pair cannot tell you which environmental process produced it.
The surf-forecast guide keeps offshore wave components separate from local coastal context. The wave-period explanation separates seconds from spacing and propagation speed. Together, these distinctions help retain the meaning of a water-related number before drawing conclusions from it.
Reader questions
Does high tide mean the current has stopped?
No universal timing rule connects high water to slack current. NOAA describes different local relationships, including cases where a current maximum occurs near high or low water. Height and current products answer different questions.
Can a tide height be negative?
Yes. A negative height is below the stated reference zero. It does not mean negative water depth. Keep the station, units and datum with the value before comparing it with another record.
Is tidal range the same as mean range of tide?
A range calculated from one specified high-low pair is an event comparison. Mean range of tide is a published datum statistic formed from mean high and mean low water. Label which quantity you use.
Sources and scope
Each reference supports the topic stated in its scope note. Worked examples are illustrative unless identified as measured results. Use current local information and the manual for your own equipment alongside appropriate practical instruction.
- NOAA CO-OPS: tide and tidal-current frequently asked questionsSeparate height and current predictions, location-specific timing relationships, and astronomical-prediction limits.
- NOAA CO-OPS: tidal datumsDatum as a height reference, local tidal datums and distinctions among published mean-water references.
- NOAA CO-OPS: tide and current glossaryRange, slack water, current direction and the distinction between instantaneous events and mean tidal measures.
Continue reading
- How to Read a Surf Forecast: Height, Period and Direction
Decode surf forecast labels with worked component comparisons. Separate combined seas, swell period and direction, then keep a record using the Swell Component Lab.
- Wave Period and Wavelength: What Deep-Water Numbers Mean
Convert wave period to wavelength with the deep-water formula. Compare crest and group speeds, check the depth assumption and follow clear worked examples.
- Wing Foiling Explained: Wing Power, Foil Lift and Control
Learn how wing foiling combines a hand-held wing with a hydrofoil. Compare it with kitesurfing and windsurfing, and understand the stages of learning.