
River Gauge Stage vs Discharge: Units and Rating Curves
Understand river stage versus discharge, gauge-height units and station rating curves. Use worked examples to keep datum, location and time with each reading.
By ActionSportsHQ Editorial · Published · 7 min read
At a glance
- Stage is water-surface height above a station reference; discharge is volume passing a section per unit time.
- A rating curve belongs to a station and its conditions; equal stage numbers at different gauges are not equivalent flows.
- Keep units, timestamp, station identity and provisional or approved status with every copied data point.
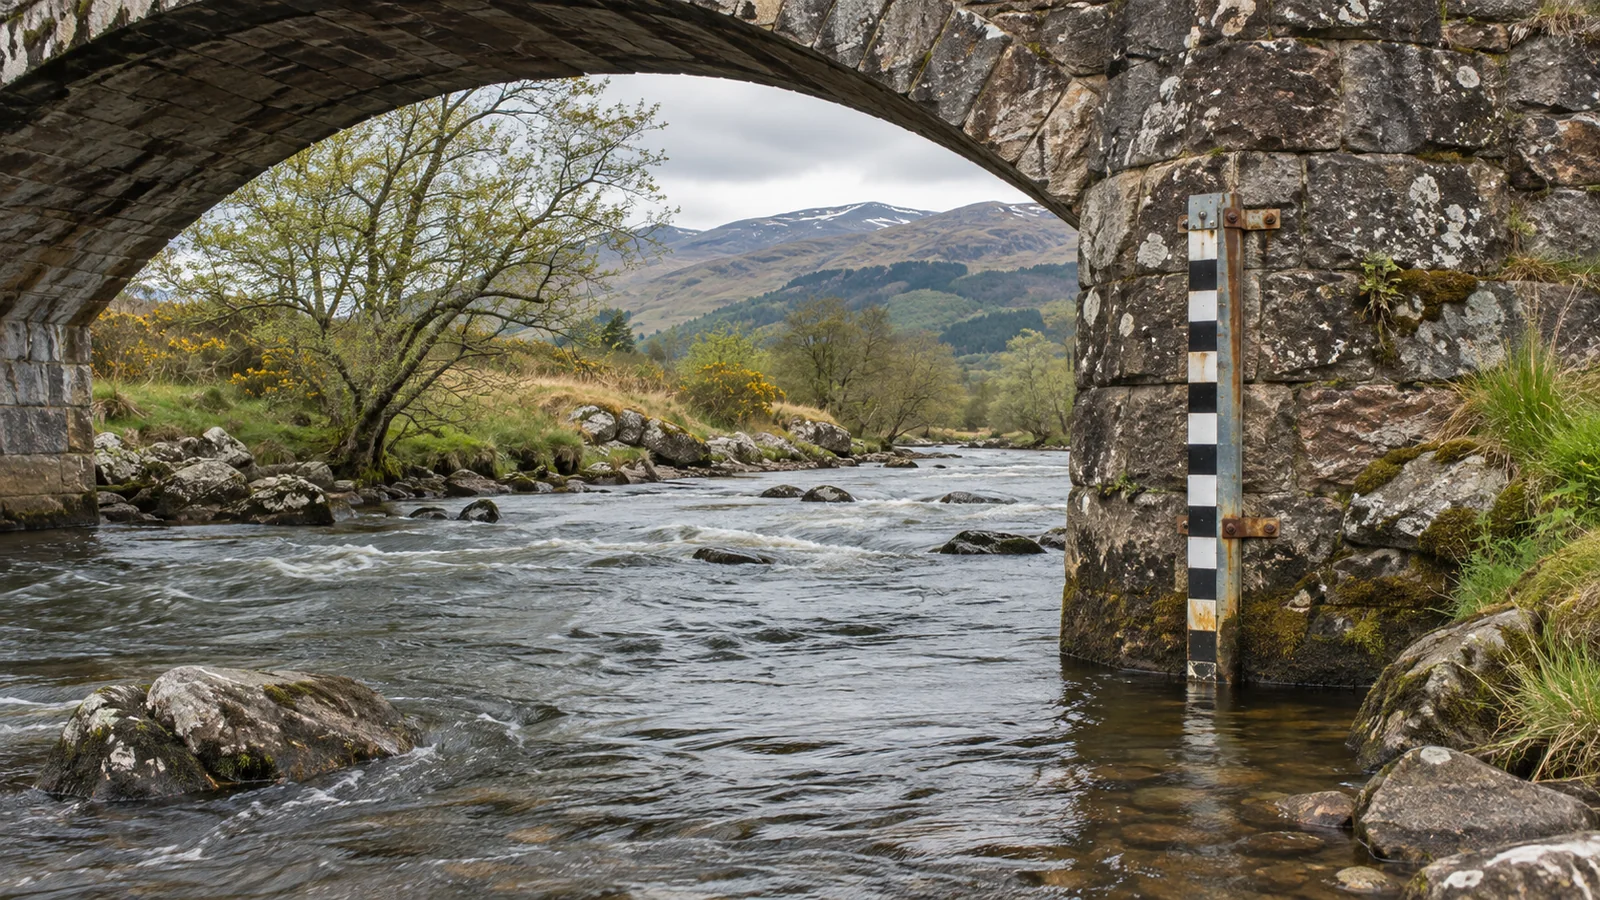
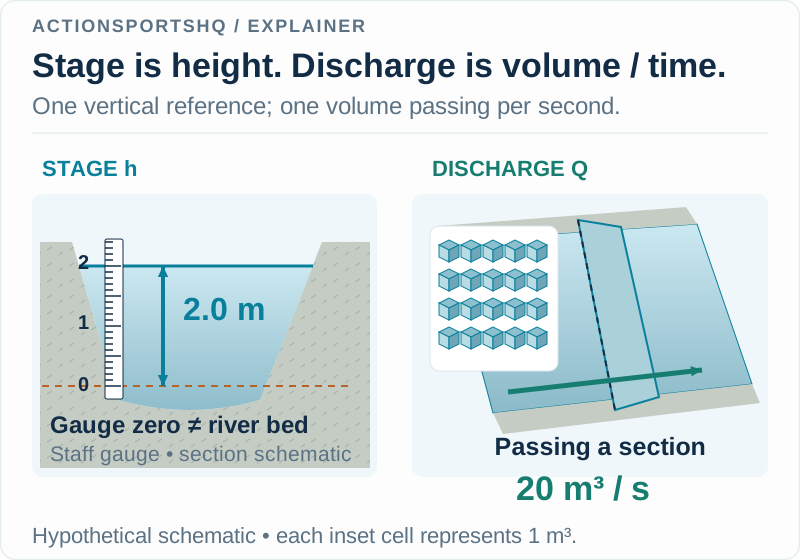
River stage, or gauge height, is water-surface height relative to a station’s stated reference. Discharge, or streamflow, is volume passing a section per time, commonly reported in cubic metres per second or cubic feet per second. Stage is not the depth at every point, and discharge is not a current-speed reading.
A station-specific rating curve can relate stage to discharge; there is no universal conversion between the two. The fictional station comparisons below show how units, datum, location and observation time keep a river-gauge reading interpretable.
Read the units before comparing the values
USGS describes stage, also called gage height, relative to an established zero. Discharge is volume per unit time, commonly reported in cubic feet per second or cubic metres per second. The basic cross-sectional relationship is Q = A × v̄, where v̄ is mean velocity. 1
| Quantity | Example units | A useful question |
|---|---|---|
| Stage h | m or ft | Height above which station reference? |
| Discharge Q | m³/s or ft³/s | Volume passing which section per time? |
| Mean velocity v̄ | m/s or ft/s | Mean over which cross-section? |
| Local water depth | m or ft | Depth at which particular position? |
Two rows share length units, but that does not make stage a map of bed depth. Likewise, discharge and velocity both describe movement while retaining different dimensions. An entry reading only “the river was 20” has lost the information needed to tell which question was answered.
Use a small calculation to expose the missing information
Imagine a fictional cross-section with wetted area 10 m² and mean velocity 2 m/s. Multiplying gives 20 m³/s. Now invent a second section with area 20 m² and mean velocity 1 m/s. It also gives 20 m³/s.
Equal discharge therefore does not identify equal mean velocity unless area is also specified. Neither calculation says that the fastest patch of water moves at the mean. The multiplication summarizes a section; it does not draw the velocity distribution.
The converse is useful too. Two sections can share a mean velocity while passing different volumes because their areas differ. When reading a flow headline, keep the volume-rate meaning intact rather than silently replacing it with the idea of “how fast the surface looks.”
These examples contain no river measurements. Their purpose is to show precisely which additional variable is missing from a comparison, instead of adding a vague statement that all rivers differ.
A rating supplies a local relationship, not a universal conversion
A station’s stage-discharge rating connects measured levels with discharge information. USGS’s ratingcurve documentation explains that its form depends on controls at or downstream of the station. A common mathematical form is Q = C(h − h₀)ᵇ, with an offset h₀ and fitted coefficients. 2
For an original illustration, define two completely fictional relationships:
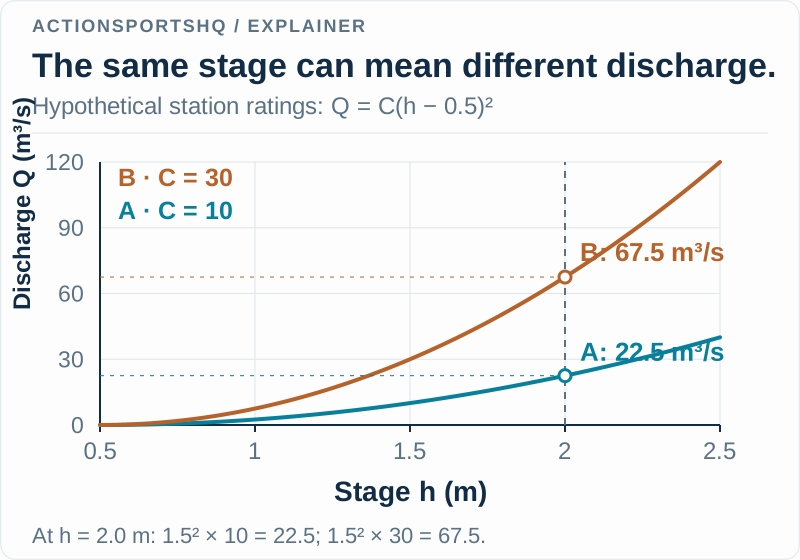
- Station A: Q = 10(h − 0.5)²
- Station B: Q = 30(h − 0.5)²
Here h is entered in metres and Q is returned in m³/s; the coefficients are chosen solely to make the arithmetic visible. Use these toy expressions only within this example, above h = 0.5 m. No fitted station data or approved rating is being provided.
Follow one stage value through both curves
At h = 2.0 m, subtracting the offset gives 1.5 m. Squaring gives 2.25 m². Our A expression returns 22.5 m³/s, while B returns 67.5 m³/s. The two stage labels match, but the calculated discharges differ by a factor of three.
| Entered stage | Station A calculation | Station B calculation |
|---|---|---|
| 1.0 m | 2.5 m³/s | 7.5 m³/s |
| 1.5 m | 10.0 m³/s | 30.0 m³/s |
| 2.0 m | 22.5 m³/s | 67.5 m³/s |
Notice another feature within A alone. Increasing stage from 1.0 to 2.0 m doubles the reported height above zero, but changes the toy discharge from 2.5 to 22.5 m³/s: a factor of nine. The offset and square make “twice the stage means twice the flow” an invalid shortcut even before another station enters the comparison.
Matching the displayed number is therefore a weak comparison. Match station identity first. Then match quantity, units, timestamp and the status of the record. Only after those fields agree can a numerical difference be examined on its own terms.
Keep the station and the river reach as separate fields
A named river is not a station identifier. A note saying “River X, 2.0 m” can remain ambiguous if the river has multiple gauges. Write the agency’s station identifier and location, then separately describe the reach or observation point you are discussing.
Suppose an old trip note names Station A, while a newly opened app defaults to Station B. If you compare only the visible river name and number, our toy curves show how the mismatch can pass unnoticed. A station column exposes it immediately. Do not patch the mismatch with an invented multiplier between gauges.
Similarly, record what was actually observed at a reach in its own column. A station time series and a photograph from another location are different evidence. Keeping both is useful; presenting one as if it directly measured the other removes the distinction.
Preserve data status and the time the value describes
USGS explains that remotely reported data can be provisional and later revised after quality checks. Separate sensors and calibration can also produce small differences between agency reports. 3 A convenient screenshot should therefore retain its data-status label as well as the value.
Distinguish observation time from the time you copied the page. A note made at 10:30 might contain the latest available observation from 10:00. Labeling it “10:30 flow” silently changes what the record claims. Keep the stated time zone, and distinguish an instantaneous value from a daily statistic when the product supplies that distinction.
Ratings also need maintenance as channel conditions change; the USGS streamflow explanation describes this continuing measurement work. 1 An old personal conversion chart is not a replacement for the agency’s current station information.
Build a record that survives a later comparison
Use columns for agency, station identifier, station name, quantity, value, units, observation time, time zone, data status and source URL. Add a separate retrieval time if you want to track revisions. Put reach-specific observations elsewhere, with their own location and time.
That structure makes several outcomes clear: “same station, different quantity”; “same quantity, different observation time”; or “same recorded observation, later revised value.” Each points to a different explanation. Averaging the two numbers before resolving those labels would conceal the useful distinction.
For the separate language of river difficulty, read whitewater grades and their limits. For a comparison with coastal measurements, tide height, range and current shows another setting where a vertical level cannot stand in for horizontal water motion. A gauge record becomes more useful when its station context remains attached.
Reader questions
Does a two-metre gauge reading mean the river is two metres deep?
Not necessarily. Stage is referenced to the gauge's stated zero, rather than every point on the bed. Depth at another place cannot be read directly from that stage value without the relevant geometry and reference relationship.
Can I use one river's rating curve at another gauge?
No. A rating describes a particular station and its controls. Another gauge can have different reference levels and a different stage-discharge relationship. Our two invented curves demonstrate why equal stage values can imply different calculated flows.
Does discharge tell me the speed of the fastest water?
No. Discharge is volume per time. In Q = A times mean velocity, the velocity is a cross-sectional mean, not a measurement of every local current. A discharge headline does not describe all water features.
Sources and scope
Each reference supports the topic stated in its scope note. Worked examples are illustrative unless identified as measured results. Use current local information and the manual for your own equipment alongside appropriate practical instruction.
- USGS Water Science School: how streamflow is measuredStage and datum, discharge as cross-sectional area times mean velocity, and development and maintenance of stage-discharge relationships.
- USGS ratingcurve project: background on discharge ratingsStation-specific controls and the form of a power-law rating with an offset; the worked coefficients here are invented.
- USGS: differences between USGS and National Weather Service river stagesSeparate sensors, calibration differences and the provisional status of remotely reported data.
Continue reading
- Whitewater River Grades: Classes, Flow and Consequences
Understand whitewater river grades and Class I–V descriptions. Compare a rapid rating with flow, continuity, access and consequences when planning a trip.
- Whitewater Kayaking Basics: Eddies, Holes and Skills
Understand whitewater kayaking eddies, hydraulics and river grades. Separate flow features, boat-control skills and swimming context before choosing a run.
- Tide Height vs Tidal Range vs Current: Read Each Value
Compare tide height, tidal range and current speed using datum and timing examples. Learn why high water cannot tell you when slack current occurs at a site.